Browsed by
Author: mark

I Have Seen the Light (Through the Cloud)

I Have Seen the Light (Through the Cloud)

It’s been a long time since I posted on this blog. That’s mainly because I got a real job which has both kept me pretty busy and partly because I cannot just blithely share the things I work on now like I used to. I started working in the role of what I eventually realized was a data engineer. To be honest, I’m not even sure I knew what a data engineer was before the title was bestowed upon me,…

Read More Read More

Voice Directed Applications

Voice Directed Applications

I haven’t posted in a while, and my new project isn’t in the sweet-spot of the blog’s focus, but I wanted to put some information up about developing for the Google Home, Echo, and text-based chatbots. These kinds of devices are certainly contributing to the massive growth of data that businesses have to work with, and the foundations of these devices (natural language processing, intents, and contexts) are leaning on machine learning to improve and expand their capabilities. When the…

Read More Read More

CSV File of Census Tract Shapefile Data for Entire US

CSV File of Census Tract Shapefile Data for Entire US

I’ve seen this request a few times, and saw it again today. The Tableau web data connector I created for census tract shapefiles requires the user to pull the data state by state. How can someone get all states at once? I looked at adding this through the normal interface, and I’m sure that would still be ideal, but I think the easiest route (for me) is to just export the entire dataset to one file that you can download…

Read More Read More

A quick update

A quick update

I’ve been distracted by another project I’m working on, so haven’t been able to update this blog as often as I’d like but I am happy that people have been using and benefiting from some of the learning projects I’ve posted here. Thought I’d just put up a few numbers. Number of commuter animations viewed (US): 327,292 Number of commuter animations viewed (UK): 22,404 Number of Tableau-ready census datasets and shapefiles requested: 3,560 Please feel free to leave a comment if…

Read More Read More

ACS Commuting Statistics Dashboard in Tableau

ACS Commuting Statistics Dashboard in Tableau

After creating the Tableau Web Data Connectors (WDCs) in the previous posts, I thought I’d learn how to create some basic visualizations in Tableau using them to extract US Census data. In keeping with another popular theme of the blog, I focused on the commuting data available in the US Census American Community Survey. I’m not sure exactly what I expected from Tableau. It is really popular right now and is, no doubt, a slick presentation tool. Like any complex…

Read More Read More

Mapping Census Tracts in Tableau

Mapping Census Tracts in Tableau

As a follow up to my previous post on the US Census Tableau web data connector I created, I wanted to also share another web data connector that allows Tableau users to selectively import Census Tract shapes for mapping within Tableau. The Census Tract is a key geography within US Census data, and it is the one that my commute map was based on. I wanted to figure out how to map at this level as I played with the…

Read More Read More

Tableau, Census Data, and Web Data Connectors

Tableau, Census Data, and Web Data Connectors

Tableau seems to be very hot right now. At least I seem to see it listed frequently when I’m looking through job postings. From my perspective, Tableau takes a lot of the presentation power of Excel (not so much the high power modeling features of Excel) and moves it into a more contemporary platform, by which I mean it is browser-based. I’ve developed many, many scorecards, charts, visualizations, reports, and analytical tools within Excel and it makes perfect sense to…

Read More Read More

Azure Machine Learning, Knime, and Spinning Your Own Hadoop Cluster

Azure Machine Learning, Knime, and Spinning Your Own Hadoop Cluster

As part of learning about Big Data, I took an online course on machine learning and played around with some of the concepts. They are two different things that get conflated frequently. Big Data is a field of deriving value from and managing huge amounts of data, levels of data beyond what organizations have ever had to deal with before. Machine learning is a discipline that uses algorithms and statistical methods to find patterns in test data that can be applied…

Read More Read More

Commuter Map Redux (England & Wales)

Commuter Map Redux (England & Wales)

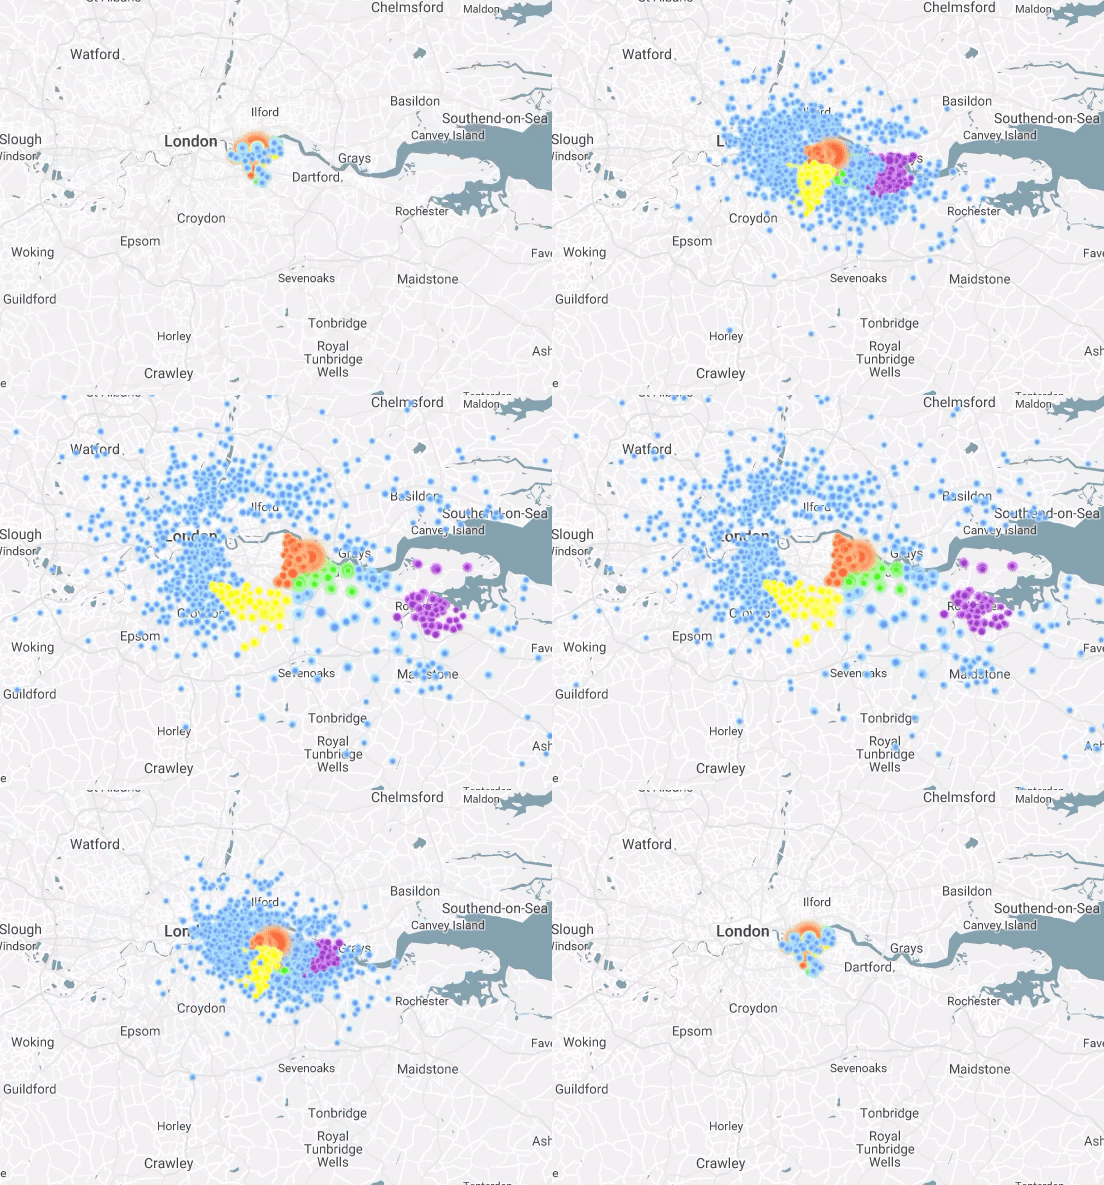
This post is all about the interactive commute map for England & Wales. You’d almost certainly rather play with that than read this. In addition to spending a week in Italy on a somewhat deserved vacation, I’ve been working on some projects that haven’t made it here yet. I’ve neglected this blog a bit, but I have a few different things that will shortly come to fruition that I will post about soon. The commute map got picked up by…

Read More Read More

ACS Commuter Data Visualizations

ACS Commuter Data Visualizations

This blog concerns an interactive visualization I put together that, for technical reasons, isn’t directly imbedded in this blog post. Go to http://bigbytes.mobyus.com/commute.aspx to see and play with the visualization. A month or two ago, I ran across a compelling visualization of commuter data done by Alasdair Rae, a geographer and urban planner based at the University of Sheffield. He runs a very cool blog called Stats, Maps n Pix that focuses on geographically oriented data and related visualizations. His…

Read More Read More