Mapping Census Tracts in Tableau
As a follow up to my previous post on the US Census Tableau web data connector I created, I wanted to also share another web data connector that allows Tableau users to selectively import Census Tract shapes for mapping within Tableau.
The Census Tract is a key geography within US Census data, and it is the one that my commute map was based on. I wanted to figure out how to map at this level as I played with the census data so I could drill down below the county level using the built-in Tableau maps.
The elusive census tract “shapefiles” seemed mysterious, but it also seemed like there could only be one real logical way to store and communicate this info: with a series of coordinates (latitude and longitude in this case) that define a shape. After finding a website dedicated to this topic, I downloaded its very helpful Tableau workbook that had shapefiles for all census tracts in the US. This can be used to get the info you need, and it is what I imported into my SQL server and used to feed my web data connector.
However, I thought this web data connector might be slightly more elegant and easy to use than pulling the info from this master file. In the example below, I’m adding census tract mapping data and building a heat map for a Tableau worksheet that I used to import census data at the census tract level for the state of Michigan. I imported the percentage of homes built before 1939. See my previous post on how to do this.
Mapping Census Tracts Using the Web Data Connector
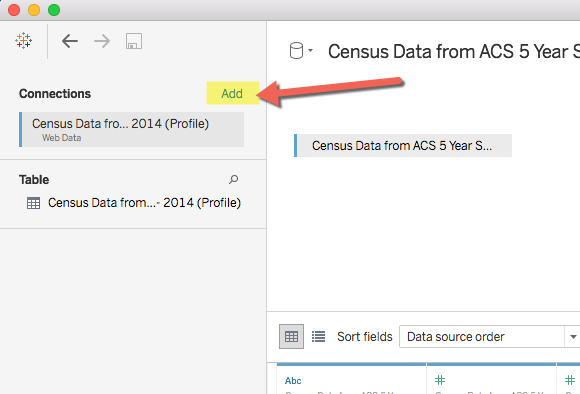 To use the census tract shapefile web data connector, “add a connection” to your workbook. For the URL, enter:
bigbytes.mobyus.com/tableau/censustractshapeswdc11.aspx
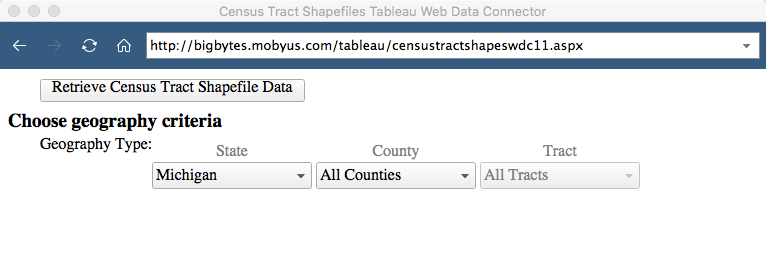
After a few seconds, an interface will pop up and allow you to choose the state, county, or individual census tract you’d like to download shapefiles for.
Select your criteria and click on “Retrieve Census Tract Shapefile Data”.
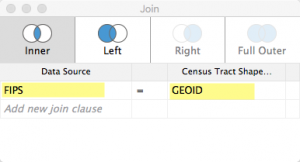 As the data is loaded, Tableau will ask you to define the relationship between the tract level data you had in your workbook and the new shapefile information. The GEOID column contains the identifier for the shape information. If you used my census data connector to import the census data, then use the value “FIPS” from that table and, as indicated, “GEOID” for the shape table info.
- This will establish the link between the two tables you now have in your Tableau workbook. Click on “update now” to finish creating the table with the shape information.

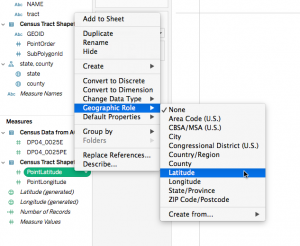 Now create a sheet. Right click on “PointOrder” and change it to a dimension. Right click on PointLatitude and change it to “Geographic Role –> Latitude” and do the same for PointLongitude, changing it to “Geographic Role –> Longitude”. Double-click on each of these to add them each to the sheet.
- Right click on the measure you want to map (we’ll assume a heat map) and select “Add to sheet”.

- On the “Marks” card, change the dropdown value at top to “Polygon”.Drag the dimension “PointOrder” and drop it on the “Path” icon on the Marks card. This tells Tableau the order in which to draw connected points on the map.
- Drag the GEOID dimension onto the bottom area of the Marks card.
- Drag the SubPolygonId dimension onto the bottom area of the Marks card. As a quick aside, I wondered why this value is needed and it is because it defines the areas (which are polygons) and it is only really needed when the shape for a particular census tract has non-contiguous regions. That is, completely separate regions that need to be defined and shaded, but are part of the same defined census tract.
- Finally, click on the control directly to the left of the measure you added to the Marks card and select “Color”.
- Your “Marks” card should look like the example below.
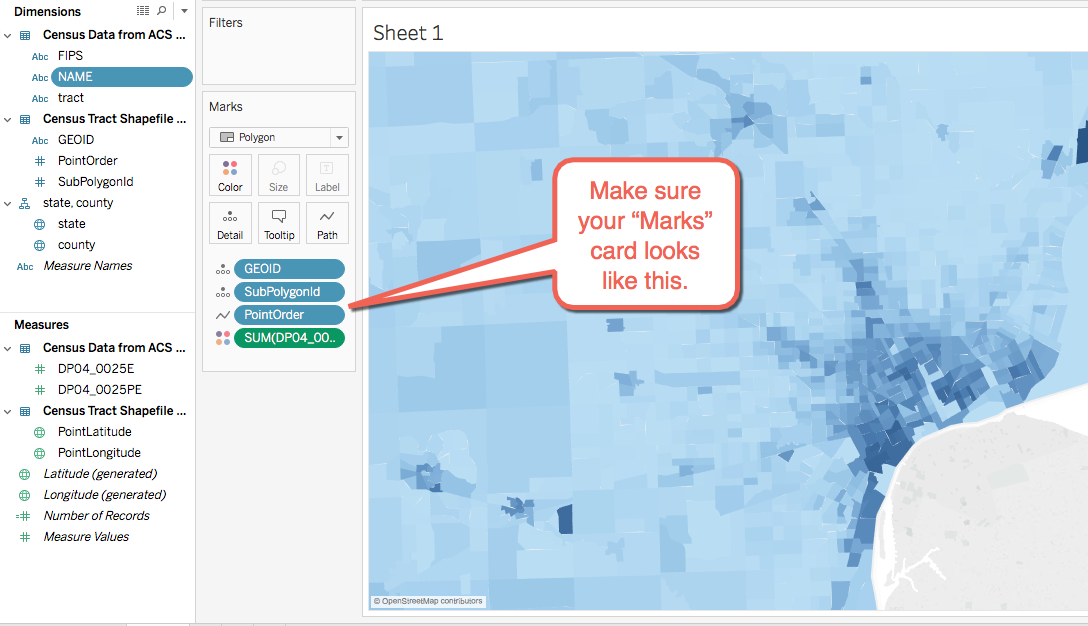
If everything went according to plan, you should have a heat map displayed like the one shown above. In the example above, the dark blue regions have higher percentages of home built before 1939 and the lighter regions have lower percentages. If you don’t have this… well, leave a comment or email me and I’ll see if we can figure it out.
Hope this new shapefile source adds a tiny bit of extra functionality to Tableau for those of you who work with data by census tract. Please feel free to comment or email me if you have questions or suggestions. Thanks.
69 thoughts on “Mapping Census Tracts in Tableau”
Thank you for the web connector! Prior to this I had to use the entire .tde file.
You’re very welcome! Glad you find it helpful.
Hi Mark,
I’m having trouble joining my data and the CensusTract Shapefiles. I’m using the full FIPS code, so for the first censustract in Manatee County, FL is 12015010100. Do you have any ideas or tips on why this wouldn’t be joining correctly? Please feel free to email me! Thank you!
Hey Jackson, Thanks for the question. Is it possible that the full FIPS code in your data is not a string, but is being assigned a numeric data type? I’ve seen that cause problems before, especially when importing from Excel. If this is the case, the join will not work as the data from my shapefile table is a string and the corresponding value in your data must also be a string. The solution is simple: Go to the data connection tab and click on the “#” symbol above the GeoId field from your Excel data and choose “String” from the list of options. That will change the data type of the field.
Let me know if this fixes it. If not, I’m happy to take a look. Can you put it on dropbox or email me the file? Not sure how big it is but that would be helpful. Cheers.
I am having the same problem as Jackson. The join won’t take place even though both linking variables are string. Any thoughts?
Hey Ken – I was able to get the connection to work with Jackon’s data. The issue appeared to be that when Tableau converts the number to a string, bizarrely it changes the number to scientific notation. I assume you’re also using Excel? The number looks fine as a number, but changes when the field is changed to a string, ruining the join. This post on the Tableau forum describes the problem and has a suggested solution. They suggest that you create a second column in Excel and populate it with the “=TEXT()” forumla. I don’t have Excel, but I was able to get it to import as a string and this did solve the issue.
Let me know if this works for you.
Hi Mark!
I had been having loads of fun with this and all of the sudden the census data and shapefiles are no longer working together. It seems when I join the FIPS and GEOID the data disappears and therefore prevents me from building a map. Any help would be appreciated.
Hey William, thanks for the note. I’m glad you’ve found these tools helpful! So far, the most common cause of the failure to join that I’ve seen is when the census data is coming from another source (Excel or CSV). Let me know if this is the case with yours. What happens is that Tableau automatically converts the value to a number, so the join is trying to work on a string to a number and that doesn’t work: both sides of the join have to be the same data type.
Unfortunately, I’ve found that when you click on the data type and select “string” as the option, it converts the number to scientific notation so the strings won’t join either. Look at other comments on this post and you’ll see more info on this issue. If this isn’t your problem, let me know. I’d be happy to take a look at the workbook if you post it somewhere where I can get to it.
Cheers,
Mark
Hey Mark,
Thanks for making this resource available. I have a quick question. So first things to know, I am importing data from an excel sheet, and when I look at the data, it is a string, so it should line up when I join with the shapefile data, as both are strings.
I first import my excel sheet, and then connect to the shapefile data. Once join the data, all my data looks like it is wiped out and when I go to map the data, I’ve got nothing. Any idea on what is happening?
If you would like to look at the workbook, here is the dropbox link: https://www.dropbox.com/s/w25eclbq56ug4zy/Cencus%20Tract%20Data%201%20.twb?dl=0
Thanks and any ideas are greatly appreciated.
Steven
Hey Mark,
I actually figured it out, but I just wanted to thank you again for the blog post and development of the census tracts web connector.
Thanks,
Steven
Thanks Steven! Glad you find it helpful!
Hi Steven,
I’m having this exact same problem — my data seems to join just fine to the shapefile data, but after the join establishes, no data shows up and I’m not able to map anything.
What did you do to fix the problem?
Thanks,
Charlotte
Charlotte, I asked Steven what his problem was. One issue I’ve seen happen is that both joined fields must be the same type (string) but when you convert some data that is numeric, it will change it to a string of the scientific notation value which won’t match properly. I asked Steven if this was his problem and this was his response, which also addresses the scientific notation problem:
Hope this helps. Let me know if you continue to have problems. I’d be happy to take a look at your workbook to see if I can identify the problem. Cheers.
Mark,
The number looked fine in Tableau as a string, didn’t appear in scientific notation but I used the formula in Excel to see if that would fix the problem and it has.
Thanks so much,
Charlotte
Great! Glad you hear you got it working!
This is so excellent…. a great resource and very easy-to-follow instructions. I am definitely bookmarking this page!
Thanks, Erica! Glad you found it useful!
Mark,
Thanks for posting this. Tableau needs some out-of-the-wrapper work here, but ’tis not to be.
I get most of the way there – able to make the join and set up the marks, but I am unable to create the map. I’m using a separate spreadsheet, much like you are, for my data. I’ve created an extract of the data (Note: Tableau would not let me proceed unless I did this). The join did not work until I changed my CT field into a text field.
Any thoughts?
Hey Arp – Thanks for the note. Sorry you’re having issues. The main issue that seems to arise is that when you convert the imported GEOID Excel field into a text field, Tableau seems to want to change it to a scientific notation format rather than keeping it as a full numeric value. You can look at your data source (the GEOID you imported from Excel) after you convert it to text and see if it still looks like a number. Others had issues that I don’t fully understand with the format. Both of these issues should be fixed by using the formula “=TEXT(CELL Number,”00000000000″)” in Excel to create another column and joining on that column once imported. Let me know if this helps. Thanks!
Excellent, just what I needed for an class I was taking online through UC Davis. Easy to follow instructions too
Glad it was helpful! Thanks for the comment.
Awesome, Mark! Hope you’re entering Iron Viz this year https://public.tableau.com/en-us/s/announcing-iron-viz-geospatial-contest 🙂
Thanks, Chelsea!
Hi,
Thanks so much for the useful post. I am trying to create a map with census tract. I downloaded the csv file for the all the US states. But when I try to load it in, there is an error message:
‘fedeval_dataengine_connection_ds’
Do you know how to get it fixed?
Thanks so much!
Hey Paul – I’m sorry. I’m not sure what is happening to your import of the csv file. I’ve attached a snapshot of what it looks like when I import the file. Are you able to view it in a text editor or spreadsheet application to see if the file looks intact?
Mark
Thanks so much Mark. I got it now. It was because the census tract on my excel sheet is text field, while the one on the shapefile is number. That why they dont match.
If you dont mind, i have another question: the map is tableau shows every country, do you know how to make show the US only?
Thanks!
Hey Paul – glad you got it working. Yes, the GEOID being imported as a number is a frequent issue. When I created the file, I made sure to put text qualifiers (“”) around that field to see if that would prompt the app to bring it in as a string, but it doesn’t seem to work so you have to manually convert it to a string. I’m sorry – don’t know the answer to your other question.
Hi Mark,
Thanks for this info. I’m wondering if you know how the process changes if I merge some of the GEOIDs into groups. The problem I’m having is that when mapped, the resulting polygons aren’t completely filled in, instead they look like they are made up of smaller triangles. These triangles don’t appear to resemble the census tracts that make up the group, but do seem to define the boundaries of the grouped polygon. Have you heard of this happening before?
Thank you!
Sorry for the delay in responding. It’s hard for me to picture what, exactly, is happening without looking directly at the workbook. When you say you are merging the GEOIDs into groups, what are you grouping on? There’s also a Tableau forum that might be helpful for you.
Mark, first of all thank you for this fantastic resource. However, I’m having the same issue. For some detail, I’m grouping census tracts into Community Tabulation Areas. The CTAs are local to my area, and are a neighborhood representation of 1 – 26 census tracts (average of 4 tracts per CTA). In my data source I have the census tracts an ACS indicator and the corresponding CTA name. When I create a hierarchy (CTA, geoid) I get a distorted map the looks like what David was describing. Same thing happens when I just plot the CTAs. Thoughts on how to resolve this issue?
I’m having trouble connecting the two data sources. I’m using Tableau 9.3. Does this only work in version 10?
Sorry, Tori, for my delay in responding. I missed your comment for some reason. When you say you’re having trouble connecting the two data sources, can you be more specific? I believe it works in 9.3, but now can’t remember if there are any issues with that. Are you unable to use the web data connector itself? If so, are you getting any kind of message?
Hi,
I was trying to retrieve the data for Nebraska state and the link “http://bigbytes.mobyus.com/tableau/censustractshapeswdc11.aspx” wasn’t working.
Could you please suggest me an alternative.
I’m a newbie to tableau, working with census tract data.
Hey Jagadeesh, I just tested pulling down the Census tract shapefiles for Nebraska and had no problems. What is happening when you try to use it?
Thanks,
Mark
Hi, I’m sorry I restarted the program and it pulled the data. Might be a technical glitch from my end.
Thanks for your response
No problem. Glad it worked for you!
Hi Mark,
I have a quick question.
I’m trying to deal with three different counties, I have the data with census tracts.
I would like to know how can I connect 3 different counties at the same time
Hey Puvvula – I haven’t tried it, but I’m thinking you should be able to use the web data connector to bring in tract shapes for the entire state, and then just map the tracts where you have available data. Have you tried that?
I tried with the complete state and its working
But I’m dealing with three counties falls into two different states.
Even I tried to connect the census tracts from my data to three different web connecters by defining the census tracts to the GEOID. But unfortunately its showing errors
Yeah – seems like a pain. I didn’t design the interface to allow for multiple counties to be selected. I see a couple of options:
1) Create a data connection for each county and export the data individually for each connection to a csv (or copy and paste it directly into a spreadsheet). Combine the three counties into one spreadsheet file and import.
2) I have a link on my blog to a full USA census tract file. You can download the file and import that. Obviously, this includes a huge amount of unneeded data.
Sorry I don’t see a better way. Let me know if one of these works for you.
Mark,
Thanks for this great tutorial. I looked through the comments, as I initially had the same issues as others. A quick SQL cast to a string solved my issue and I have a beautiful heatmap. Thanks for making this easy!
So glad you found it helpful!
this is great. Is there something similar for census blocks as well? or is tracts as small as we can go?
Hey Nicole – It’s been a while since I worked on this so I’m taking a look at it. I’ll see why I left this out. I’m assuming it wasn’t available via the API, but I’ll confirm. Note that (and you may know this) I believe block group is natively supported within Tableau for a few different Census variables. You should be able to search and find more info. I’ll let you know if I’m able to active any of the data at that level.
This is wonderful. I was able to make it work with my measures in a wide data table (a single row for each tract and one column to use as the measure).
Have you tried this with long form data? I now have a dataset with several rows for the same tract ID. The data must be filtered by “topic” and “year” to limit the data to just one row per tract. I tried following the same steps and then dragging my two filters (topic and year) to the filter area. However, the map didn’t appear at all. Do you have tips for doing this with long data that need to be filtered? I am new to Tableau, so I’m learning these things a piece at a time. Thanks!
Hey Natalie, I’m glad you found it useful. I can’t say I’ve tried the exact scenario you describe, but I can see why the map would need a unique row per tract to map properly. There’s probably a way to aggregate the data to unique tract within a sheet for that, but I’m not really familiar enough to tell you how that would work. You could try the Tableau forums and see if someone there can answer this for you. Cheers!
Thanks for the reply. I was able to get the map to work by unchecking “Aggregate Measures” in the analysis menu. It seems that option might be extra-important if you have several rows per tract.
Thanks for the tip!
I see several gaps between tracts and some tracts that overlap the borders of other tracts. Is that normal or should the borders be pretty seamless?
I’ve seen that, too. The shapes are defines by a series of Lat/Lon points and they apparently are not seamless. These shapefiles I got from another blog that had all of them loaded in a single Tableau workbook. If you find others that are better, let me know. Cheers.
Hello Everyone,
I see that few people had same as issue as mine here. After join, Data disappears.
But I changed Geoid to text using TEXT(). But the issue still persists. Can you help me fix it?
Hey Yamini – Just to confirm, you used “TEXT()” in Excel to create a new column for GEOID and then imported directly from Excel? It’s been a while since I looked at this closely, but I believe that’s what you have to do. Do the values look like they should join ok (i.e. the values are in the same format)? Is the GEOID from your dataset a text field in Tableau? Cheers, Mark.
Hi Mark,
Yes. I did all that. But I’m suspecting that its my FIPS code field messing up the data. Coz, when I use your connector instead of Excel, GEOID is fine, But when i do the join with FIPS code, Data is vanishing. I got this State-county FIPS code file from online. Do you have any suggestion for getting the correct FIPS code file?
(My original data has State, City, Sales region,Census Tracts) So, I have multiple joins here.
1. My Data with FIPS Code file(joined by state)
2. FIPS file with All_ Census Data(geoid-fips code)
Yamini – Could you paste in a few rows so I can see what the actual data looks like?
Business Center State Sales Locality Census Tracts
032-NORTHEAST CONNECTICUT A004-ANSONIA CT 09001100200
032-NORTHEAST CONNECTICUT A004-ANSONIA CT 09001100300
032-NORTHEAST CONNECTICUT A004-ANSONIA CT 09001110100
032-NORTHEAST CONNECTICUT A004-ANSONIA CT 09001110201
032-NORTHEAST CONNECTICUT A004-ANSONIA CT 09001110202
032-NORTHEAST CONNECTICUT A004-ANSONIA CT 09001110301
032-NORTHEAST CONNECTICUT A004-ANSONIA CT 09001110302
032-NORTHEAST CONNECTICUT A004-ANSONIA CT 09001110400
032-NORTHEAST CONNECTICUT A004-ANSONIA CT 09001110500
032-NORTHEAST CONNECTICUT A004-ANSONIA CT 09001110600
032-NORTHEAST CONNECTICUT A004-ANSONIA CT 09001230501
032-NORTHEAST CONNECTICUT A004-ANSONIA CT 09009120100
032-NORTHEAST CONNECTICUT A004-ANSONIA CT 09009120200
032-NORTHEAST CONNECTICUT A004-ANSONIA CT 09009125100
032-NORTHEAST CONNECTICUT A004-ANSONIA CT 09009125200
032-NORTHEAST CONNECTICUT A004-ANSONIA CT 09009125300
032-NORTHEAST CONNECTICUT A004-ANSONIA CT 09009125400
032-NORTHEAST CONNECTICUT A004-ANSONIA CT 09009130101
032-NORTHEAST CONNECTICUT A004-ANSONIA CT 09009130102
032-NORTHEAST CONNECTICUT A004-ANSONIA CT 09009130200
032-NORTHEAST CONNECTICUT A004-ANSONIA CT 09009141100
032-NORTHEAST CONNECTICUT A004-ANSONIA CT 09009141200
032-NORTHEAST CONNECTICUT A004-ANSONIA CT 09009160100
032-NORTHEAST CONNECTICUT A004-ANSONIA CT 09009160200
032-NORTHEAST CONNECTICUT A004-ANSONIA CT 09009161100
032-NORTHEAST CONNECTICUT A004-ANSONIA CT 09009341100
032-NORTHEAST CONNECTICUT A004-ANSONIA CT 09009346101
032-NORTHEAST CONNECTICUT A004-ANSONIA CT 09009346102
032-NORTHEAST CONNECTICUT A004-ANSONIA CT 09009348123
032-NORTHEAST MASSACHUSETTS A005-ATHOL MA 25011040400
032-NORTHEAST MASSACHUSETTS A005-ATHOL MA 25011040501
032-NORTHEAST MASSACHUSETTS A005-ATHOL MA 25011040502
032-NORTHEAST MASSACHUSETTS A005-ATHOL MA 25011040600
032-NORTHEAST MASSACHUSETTS A005-ATHOL MA 25027702200
032-NORTHEAST MASSACHUSETTS A005-ATHOL MA 25027703100
032-NORTHEAST MASSACHUSETTS A005-ATHOL MA 25027703200
032-NORTHEAST MASSACHUSETTS A005-ATHOL MA 25027703300
032-NORTHEAST MASSACHUSETTS A005-ATHOL MA 25027704200
032-NORTHEAST MAINE A009-AUBURN ME 23001010100
032-NORTHEAST MAINE A009-AUBURN ME 23001010200
032-NORTHEAST MAINE A009-AUBURN ME 23001010300
032-NORTHEAST MAINE A009-AUBURN ME 23001010400
032-NORTHEAST MAINE A009-AUBURN ME 23001010500
032-NORTHEAST MAINE A009-AUBURN ME 23001010600
032-NORTHEAST MAINE A009-AUBURN ME 23001010700
032-NORTHEAST MAINE A009-AUBURN ME 23001010800
032-NORTHEAST MAINE A009-AUBURN ME 23001020100
032-NORTHEAST MAINE A009-AUBURN ME 23001020200
032-NORTHEAST MAINE A009-AUBURN ME 23001020300
Hey Mark,
I don’t think its a good idea to paste data like this, If there is any other way to share files,Please let me know.
Yamini – No problem. I got what you pasted. I don’t know what’s happening though. It looks like it should join ok. So, you’re joining the id (top one in the sample you gave was “09001100200”) to the GEOID in the census tract shapefiles you downloaded via the web data connector?
One question: it looks like the data is across multiple states. I know my connector only allows you to pick state by state. How are you getting all of the states you need?
Hey Mark,
Awesome stuff, thanks so much for the web connector! Is there a way to dump all of the states with the polygon point order? I’m currently working with a rather large dataset that covers multiple states, and would like to show it all on one map file, rather than working through individual states one-by-one.
Thanks again for the great work.
Jake
I didn’t see this comment as approved, but I think I did respond. Jake – it may be way late by now, but I have a link to a static file of all tract shape data for all states. It is in a separate post: http://ilikebigbytes.com/index.php/2017/03/14/csv-file-of-census-tract-shapefile-data-for-entire-us/ .
This is, as others have noted, fantastic! I did have a couple of comments/questions:
1. Background layers are covered, so one has no way of actually seeing political boundaries or names (e.g., cities or states). Is there a way to bring these boundaries to the foreground?
2. Does Tableau make it possible to overlay your worksheet with a view that incorporates point locations of stores or specific sites that also depend upon unique longitude/latitude data?
Thank you!
Thank you for sharing this! I’m wondering if there is anything similar available at the block level? I am trying to map something that is different for each FIPS 12 digit code.
Hi Mark,
What year/census are these census tracts from? I’m trying to get the shapefiles for 2000 census tracts into Tableau. I tried mapping with these and got some very odd results that made me think the tract numbers may have changed significantly.
Thanks,
Becky
Mark,
This is fantastic work, thank you for sharing it!
Can you explain why the “block” level option is grayed out? How difficult would it be to include this instead of “tract?”
Thanks,
John
Hi Mark,
This is incredibly helpful, thanks for putting together!
I’m trying to create a national map using the census tract csv file you posted in your other post. I joined the data and ran through the other steps above, but I’m seeing an error that the latitude field has >2M null fields. Looking back at my data tab, the data all looks like it joined correctly, and I’m not seeing any null fields. But, I’m not seeing any data on the map.
Any idea what might be happening here?
Thanks for your help!
-Mike
Actually, nevermind – got it figured out. Thanks anyway!
-Mike
Just read this article today, August 20, 2018 and this is great!
Wished I would have read this much sooner!
Currently, I do not have Tableau and the objective is to display to the departmental end users a visual of the real estate sales on a periodic basis using just MS Excel 2016.
(Just started this job and have lots of real-estate related data that includes just the street address, city, state, zip code, sales price, etc. and am tasked with creating visuals. Do not know really where to start.)
So, I initially determined if I have access to Power View/Power Map and it appears that there are “compatibility-related issues with Power View and MS Excel 2016.
Able to bulk geocode the data and obtain additional info such as latitude, longitude, etc.
But, I have to manually create the Census geoids, Block Group geoids, etc.
Questions:
Any thoughts/insight as to whether I definitely need to use Tableau or stay with MS Excel to meet the objective?
Also, is it possible to use a web-based tool or other method to “auto-populate” the geoids in several columns on the MS Excel worksheet based on the address that is a separate column?
Thanks in advance.
Hi Mark,
Thank you so much for this great article! I have been trying to use your Web Data Connector for some time and have come across some issues, that I am hoping might have a solution. What I am looking to do is create a map of GRAPI from ACS 5 year estimates (2011-2015) by census tract.
Method 1:
I downloaded the data directly from American Fact Finder and attempted to link it in Tableau with your census tract shapefile web data connector. Even though I did use the =TEXT formula in excel to convert my GEO.id column to text, it still was converted to scientific notation in Tableau. I tried this a few times and then went on to
Method 2:
I attempted to use your census tract shapefile web data connector, and connect it to your Census Data WDC. I received this error: “The web data connector has reported an unrecoverable error and cannot proceed. If the connector has reported details of the error, they are displayed below – ‘error while trying to connect to the Bigbytes census data source'”
I appreciate any insight you may have into why I am receiving this error using Method 2!
Thank you!
Hi Mark, thank you for your work on this. This is day 2 for me on Tableau, but I was able to create the equivalent of your heat map above (although it took some time to get the join to work but it was all tied to the formatting of the tract field in excel). I was wondering if it is also possible to overlay county boundaries on top of the map?