Tableau, Census Data, and Web Data Connectors
Tableau seems to be very hot right now. At least I seem to see it listed frequently when I’m looking through job postings. From my perspective, Tableau takes a lot of the presentation power of Excel (not so much the high power modeling features of Excel) and moves it into a more contemporary platform, by which I mean it is browser-based. I’ve developed many, many scorecards, charts, visualizations, reports, and analytical tools within Excel and it makes perfect sense to adapt these kinds of deliverables into a browser-based tool.
Tableau has a public version that you can download for free and use to create and publish workbooks to Tableau Public for everyone to see. I’m still learning the features, and there are a lot of learning resources on the web if you search around.
One thing I wanted to do was to tap into a great, diverse data source and create some Tableau workbooks to play around with. My commute map used US Census data from the American Community Survey, and when it was making the rounds back in June I was contacted by the Census Bureau asking if I was aware of their API. I wasn’t, though I wasn’t surprised to learn of one. I decided to tap into this data as I learn Tableau, because the Census Data has great breadth of information but also has a terrific multi-tiered geographic component.
Tableau has the ability out of the box to accept data from a wide variety of data sources, but it also has a way for developers to build a conduit into Tableau from any data source. This standardized data conduit into Tableau is called a “Web Data Connector” and a number of organizations have built these to enable Tableau users to import data. I looked for a Web Data Connector (WDC) for the Census API, but wasn’t able to find a working version. Always one to support scope-creep, I decided to build one myself and I did. It connects to the ACS Profile data for the five year estimate ending in 2014.
Unfortunately, I built it based on their WDC version 1.1 just as they were transitioning to a new version (2.0) with more features. If this gets any real use, I’ll look at upgrading the connector to 2.0. Below is a step by step on how to retrieve Census Data into Tableau using my WDC:
Importing Census Data into Tableau
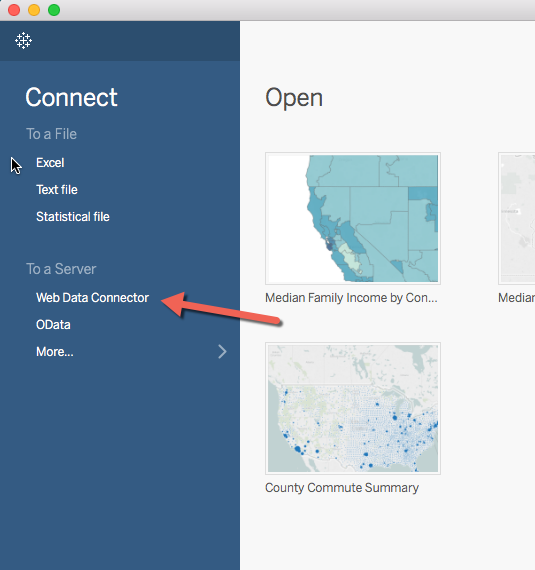
Obviously, in order to use the WDC, you have to have Tableau loaded and if you do and you start a new workbook, you should see that you can choose “Web Data Connector.”
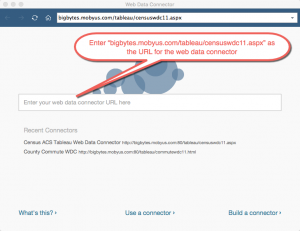
When you do choose “web data connector”, you’ll see a screen that asks for the WDC’s URL. To use my Census Data WDC, you’ll want to enter:
bigbytes.mobyus.com/tableau/censuswdc11.aspx
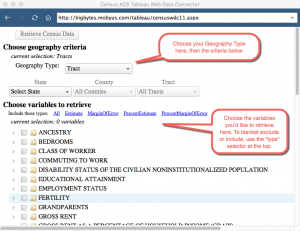
Once the data connector interface loads, you can choose a Geography (State, County, SubCounty, Tract, Zip Code, etc.) that you would like to retrieve and choose which variables you would like to include. The variables are one of the harder things to manage here. There are lots of them (about 2,500) and the names are cryptic. The list of variables for this particular Census dataset can be used as a reference.
You can use the hyperlinked text just above the variable list to include or exclude variable types. For example, if you want to include only “Estimates” then unselect the other three types “MarginOfError”, “PercentEstimate”, and “PercentMarginOfError”.
“Estimate” is the nominal value you’re probably most interested in. For example, if the variable is “population”, then the “estimate” would be the estimated number of people living in the selected geography.
Once you’ve selected your criteria, click on the “Retrieve Census Data” button at the top of the web data connector interface. The system will then retrieve the data from the Census API and convert it into a format that Tableau can readily accept. You can then click on “UPDATE NOW” when the data is returned to finish creating the data table inside your new Tableau workbook.
Many of the geography types provided by this WDC are supported for mapping in Tableau so you can create heat maps and other visual representations quickly and easily once you have the data imported. Some of them work automatically, others need a little help. Feel free to email me or post a comment if you have questions on this.
I also created a shapefile web data connector for the US Census Tracts, a geography that isn’t natively supported within Tableau. I’ll be posting on how to use this to map Census data by Census Tract.
If this tool gets any significant use, I’ll consider adding a dropdown at the top to allow users to choose data from other US Census datasets (10 year full census or other ACS datasets.) Let me know if you have any suggestions on how to extend this functionality. Here’s a link to a quick map I put together using this data. It shows Census Tracts in Washtenaw County, Michigan by percentage of residents with graduate degrees. The bluer regions have higher levels of the population with grad degrees and the greener areas have lower levels. Can you guess where the University of Michigan is on this map?
Thanks!
23 thoughts on “Tableau, Census Data, and Web Data Connectors”
lol at the ‘always one to support scope-creep’ line… sounds familiar!
I work for the City of LA data team and this is hugely helpful, thank you. Please keep it going and reach out if you’d like to collaborate!
A few pieces of feedback-
1. It appears you can click a parent checkbox to select all below, but you cannot click it again to deselect all. Instead, you need to individually open each nested variable and de-select measures individually.
2. On a similar note, you’re only notified that there is a limit of 49 variables once you go over that limit. So, for example, I went down the list and selected a ton of things because I didn’t realize the limit and then I needed to individually deselect. It would be great if it said something like ‘x variables selected out of 49 max’ as you’re going
Hey Chelsea, Thanks for the note! I’m glad you find it helpful. I’d love to collaborate on something if you have ideas. Let me know!
I appreciate the feedback. I just tried it, and I’m not able to duplicate the behavior you describe with the parent checkbox. When I click the parent, all children are selected. When I click it again, all children are unselected. The behavior is a bit different if there are some children deselected and some selected: the parent shows a block instead of a check, but you can still click the parent to select all and again to deselect.
I’m using Chrome for MacOS. Let me know what browser/OS you’re using.(Just realized the browser is not an issue since it runs inside Tableau.)I made a quick video just to confirm we’re talking about the same thing.
On the variable count issue, it does flip but because you’ve scrolled down it isn’t visible. I think that is the issue. I’ll think about how to make that more visible as you’re going. Thanks for pointing this out.
Cheers,
Mark
Chelsea, I made a quick change to the connector so that the info on variable count is fixed to the top of the window on the right side. Now you should be able to see how many variables you have chosen and the warning message will pop up when you hit the limit. By the way, the variable count limitation is set by the Census Bureau’s site.
Let me know if you have any problems using the connector.
Hi Mark,
This is incredibly helpful. Thank you so much!
Would you be open to either making the source code available or updating the ACS to include 2015?
Thank you!
Rosangela – Thanks for the note! Glad you find this helpful. I didn’t realize there was new data for ACS. I will definitely look into it.
Hey Rosangela, I added the 5 year ACS Profile (2011 – 2015) to the web data connector. Let me know if any problems using it. I hope it is helpful. Cheers, Mark.
This is so wonderful! I used the state level, and noted that the data uses the FIPS code rather than the state abbreviation. I pulled down the FIPS conversion from the census here:
https://www.census.gov/geo/reference/ansi_statetables.html and saved that into Excel. I needed to add another Excel field that had the FIPS code as a two digit string number so that Tableau would join it with the state field, and then all went as expected.
Hey there Claire – Thanks! I’m glad you find it helpful. You’re correct that the two digit state abbreviation is not included, so if you’re matching to other data on this (or want to display it) you need to use something like the solution you outlined. However, Tableau will create a map directly from the FIPS (and possibly from the state name alone I think). Thanks again for the comment and the info!
hi mark,
I’m doing a GIS project for the Latino Community Credit Union and trying to visualize Hispanic/Latino data by census tract statewide… when I select that field, it gives me a 64 variable error. Is there any way around this, as I do need all counties’ hispanic tract level data?
Hey Parv – Thanks for the note. The US Census API has a built-in limit of 49 variables in one request. Because beneath the Latino/Hispanic “tree” there are 64 total variables that you are specifying to retrieve, the system won’t execute that request.
There are a couple of ways to resolve:
1) In the data connector interface, drill into the tree of available variables and select only the variables you actually want and need. There are four types of variables for each and every slice: estimate (the actual population count), % estimate (% of the total), margin of error (+/- in nominal population count) and % margin of error (the % of total error represented by this margin of error). You may not want all of these. Also, if you don’t use the more detailed breakouts by country/region (“Puerto Rico”, etc.) you can deselected them. I included a screenshot of this part of the variable tree below.
**** If you’re looking purely for Hispanic/Latino stats, there are only 20 of them in the main section for “Hispanic/Latino” beneath the first level group named “HISPANIC OR LATINO AND RACE”. A bunch of others (Asian, etc) are in the other main sub-branch “Not Hispanic or Latino”.
* Note that if you want to exclude a whole type of variable (say, margin of error %), you can do that at the top of the data connector interface.
2) If you really want more than 49 variables, you can create two data connections and join them on census tract id. If you haven’t done joins before, it lets you connect to tables/data sources that have a common, relatable key (in this case, census tract). Let me know if you have questions on this one.
Hi Mark,
I used your web connector. However, i get the first row (coded column names), instead of english names for the columns I extract. Is there a way to fix that?
Robin – Yes, those are the literal column headings supplied by the Census API that are simply passed through. You have to either translate the column headings by looking at the Census data dictionary for the API or it may work for you to check the box that says “Pivot variables into rows?” which will put the variable names into the rows. Let me know if you have any problems.
It worked Mark. Thank you 🙂
Can you please create a web connector for SF1 database ? For 2010-14.
Hi Mark, I was wondering if would be working on creating one? I really need it.
🙂
Hey Robin – Thanks for the comment. I took another close look at the SF1 for the 2010, but now looking at your comment I see you may be looking for the ACS 2010-2014. I don’t see anything called SF1 for the ACS. Can you clarify what you’re looking for? That said, the ten year census variables are very different than the ACS I did so would probably involve a fair amount of work. I can’t promise anything but I’ll look into it.
Hi Mark,
Thank you so much.
SF1 is separate from the ACS. You can find about it here. https://www.census.gov/2010census/news/press-kits/summary-file-1.html
With ACS, I already used it but it doesn’t gives information such as population density by census tract or residence type (house, condo, apartment) etc. SF1 has more info tables.
Do you have any suggestions on how to connect the data directly to tableau. Or is it advisable to just download the table from American FactFinder?
Hey Robin – Yes, I understand. I was confused by your range for SF1 of 2010-2014. The SF1 AFAIK is just for the decennial census for 2010. I’m sorry, but I’m really not sure on the best way to approach Tableau import for SF1. You may have tried it, but the Tableau forums are always a great source of advice and info. Good luck and I’ll let you know if I get time to adapt SF1 to my web data connector.
Hi Mark,
Just found this connector and love it! I receive an error when trying to load the Metro/Micro Stat Areas for the one year profiles. Error below, is this something I’m doing wrong? Thanks!
TypeError: undefined is not an object (evaluating ‘sel_option_data.CensusGeoId’) file: http://bigbytes.mobyus.com/tableau/censuswdc11.aspx line: 291
Hey James – sorry for the delay in responding. I’m glad you like it. I was just testing it out to replicate your issue. It shouldn’t let you choose “Metro/Micro Stat Areas” for the one year profiles. When I try, that option is disabled in the dropdown selector. I am able to do it for the 5 year profiles. This means that the API doesn’t provide the one year at that level (possibly due to the small sample sizes for one year views.) You’re saying that the interface is allowing you to choose a one year ACS dataset for Metro/Micro Stat Areas? Sorry for any issues.
Hi Mark,
This web data connector is so useful! Would you be willing to open-source this and accept help with updating the census’s recent(ish) change to the format for API call, and upgrading to WDC 2.0? I’d be really interested in this.
Hey Mark,
Thanks for creating this. It is exactly what I was looking for in order to semi automate a dashboard that I’m developing for a project I’m working on.
I’m looking to be able to update the census data annually (with each year’s ACS 5 year data) and although I’m using county subdivisions and counties for most of the data I’m pulling, for NJ I also need the data at their “places” level to fill in some geospatial gaps. I’d hate to have to message you each year in hopes you’re still willing to update the WDC. Is there any chance you’d be willing to send along the script you used for the WDC so that I can host it on my own server and update it as needed?
I understand if you’re not willing to do that.
Thanks.
Hello Mark,
This is a great tool for Tableau. Are you planning to include ACS 2013-2017?
Thanks.